
Farm Advisor Culumber is in Awe
Catherine Culumber is Impressed by Big Production
By Patrick Cavanaugh, Farm News Director
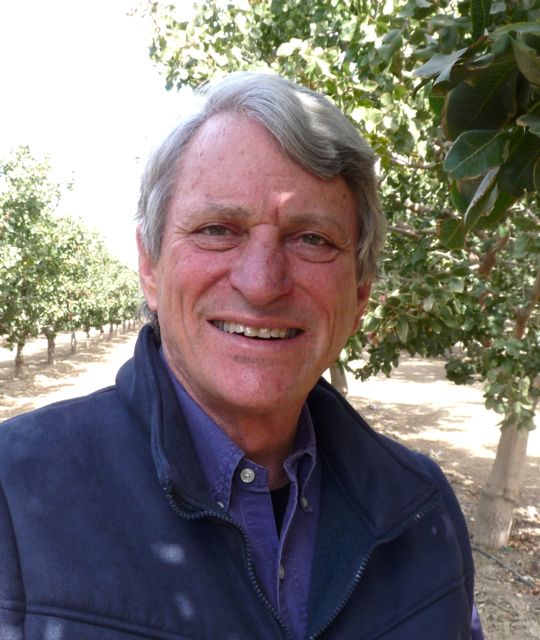
Catherine Culumber is a UC Cooperative Extension Orchard Crops Farm Advisor in Fresno County. She has been on the job since June 30, and we wanted to catch up with her since she’s gotten her feet on the ground.

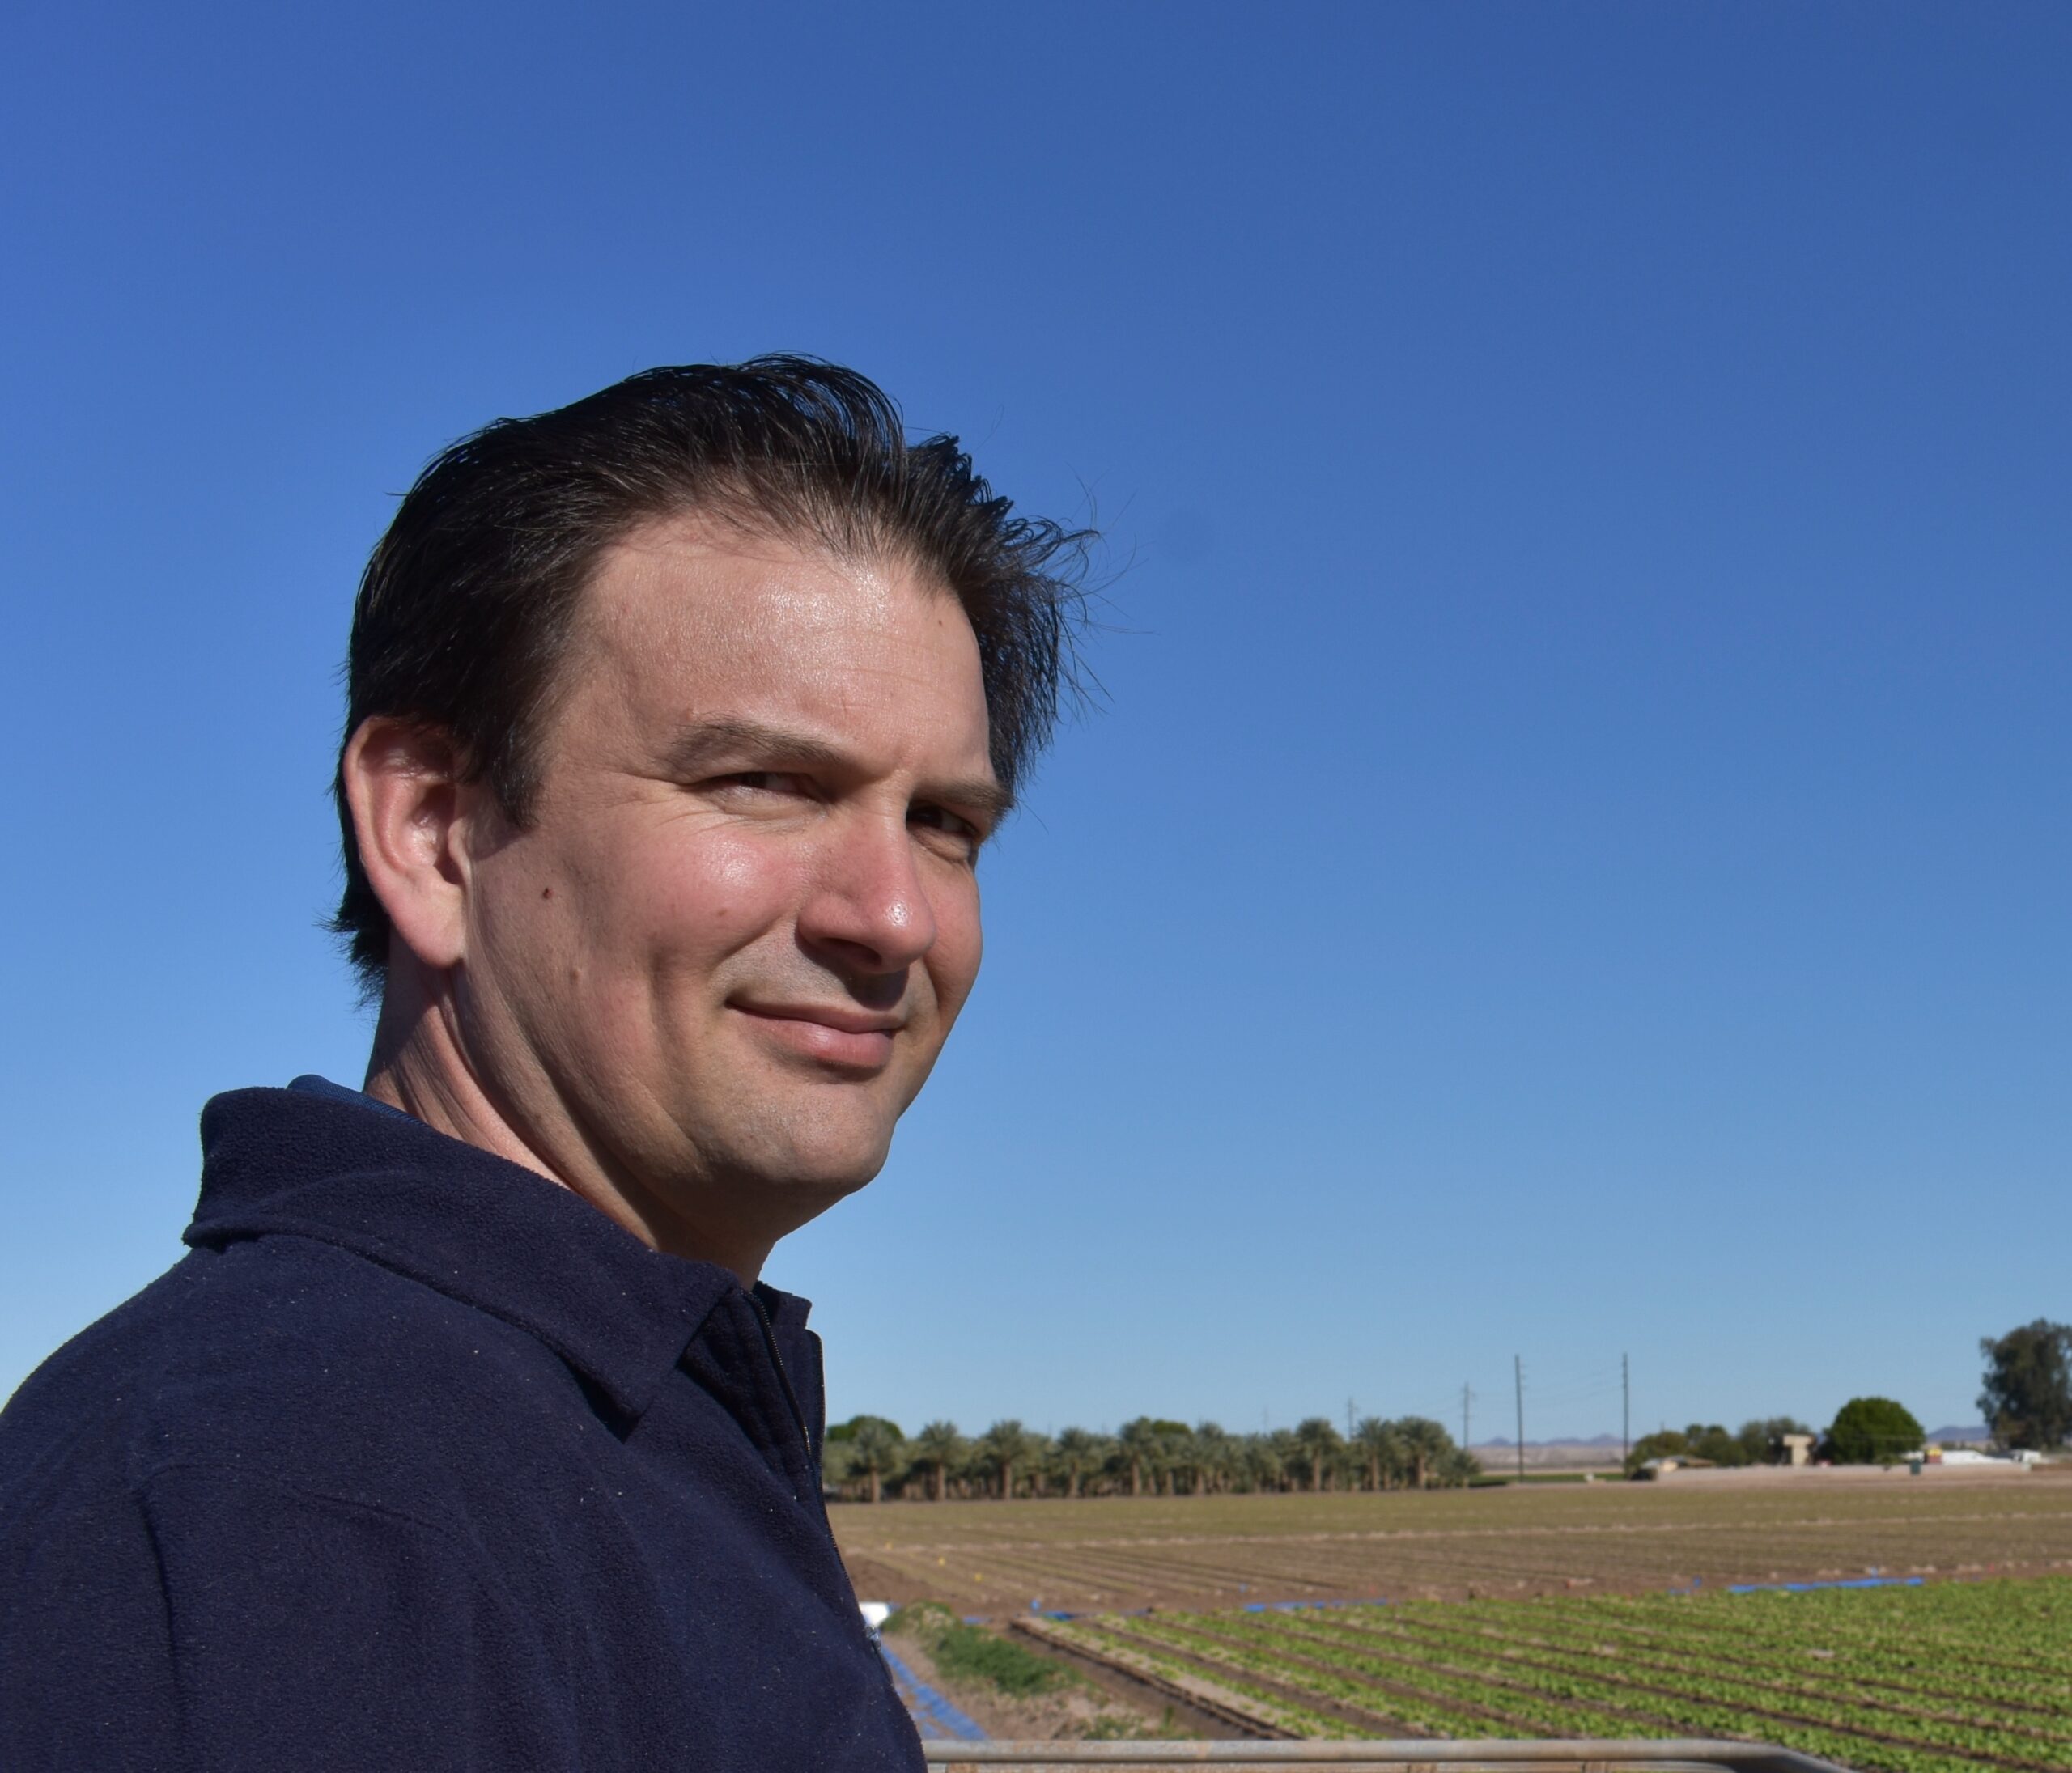
Catherine Culumber, UC Cooperative Extension Farm Advisor, Fresno County.
She came to the position with a Masters in Plant Science and a PhD in Soil Science.
“I’m so happy to be here, and it’s been great to get to know the network of people working in the University of California Cooperative Extension. There is endless amounts of resources and wealth of knowledge that I feel really fortunate to have.”
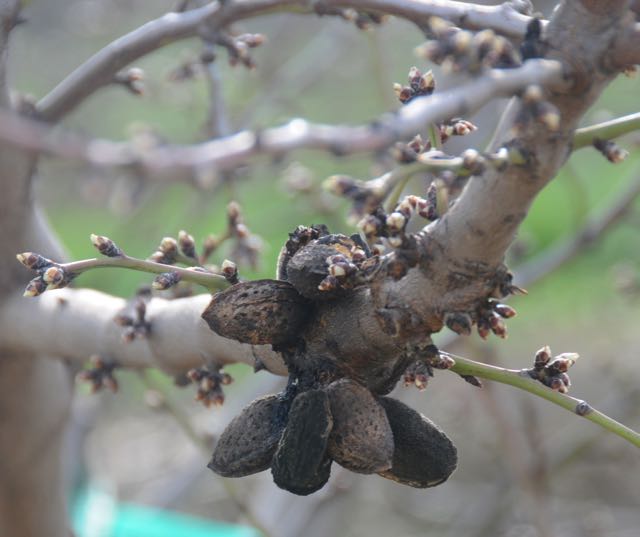
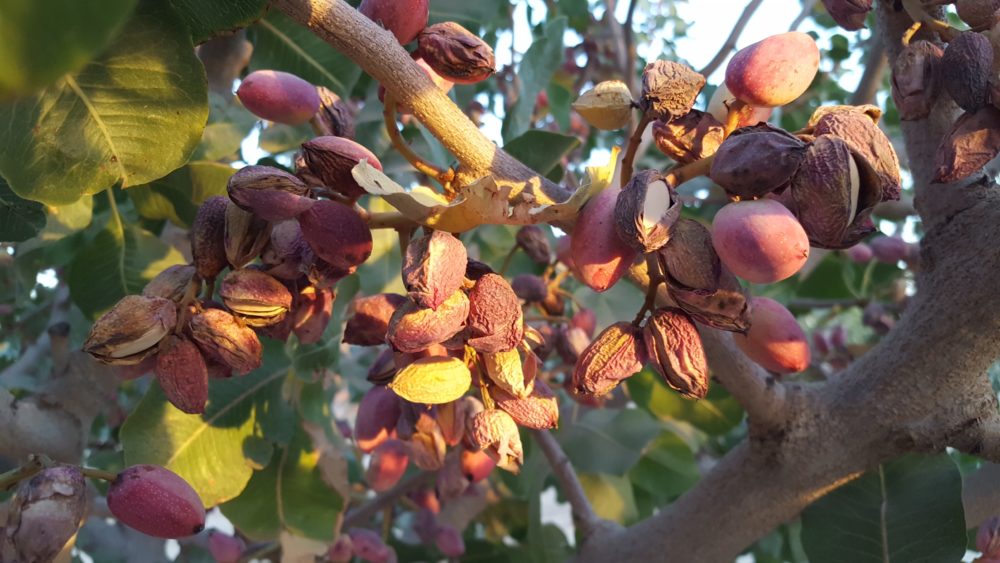
She is working with almond, walnut and pistachio growers, with the majority of her calls from almond producers.
Culumber was surprised with the vastness of Fresno County and all the production here. “My PhD research was in orchard systems at Utah State University, and it didn’t nearly prepare me for the infinite acreage that I saw upon arriving here,” she said.
She said that she has met some very innovative growers, and they all seem to be doing the best they can for the family farm.
“I think that farmers are very adaptable, and I can see that in recent years with the decrease in water availability, most people have adapted and gone to different micro-irrigation systems to increase their water use efficiency,” Culumber said. “The farmers are working hard to not only be sustainable, but they’re smart business people as well.”